Population
Significant political change in the U.S. has often followed changes in where Americans were living. These maps allow users to trace large-scale national trends of the past, including westward migration, urbanization, and suburbanization, at a glance.
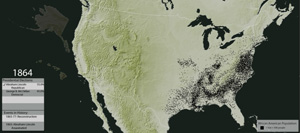
African American Population Density, 1840 - 2000
This map shows black population change in U.S. counties from 1840 to 2000. Each dot represents 500 people.
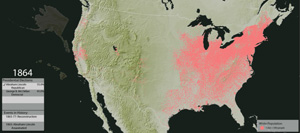
White Population Density, 1840 - 2000
This map shows population change among whites in US counties, 1840 to 2000. Each dot represents 500 people.